ANOTHER SIMPLE DASH
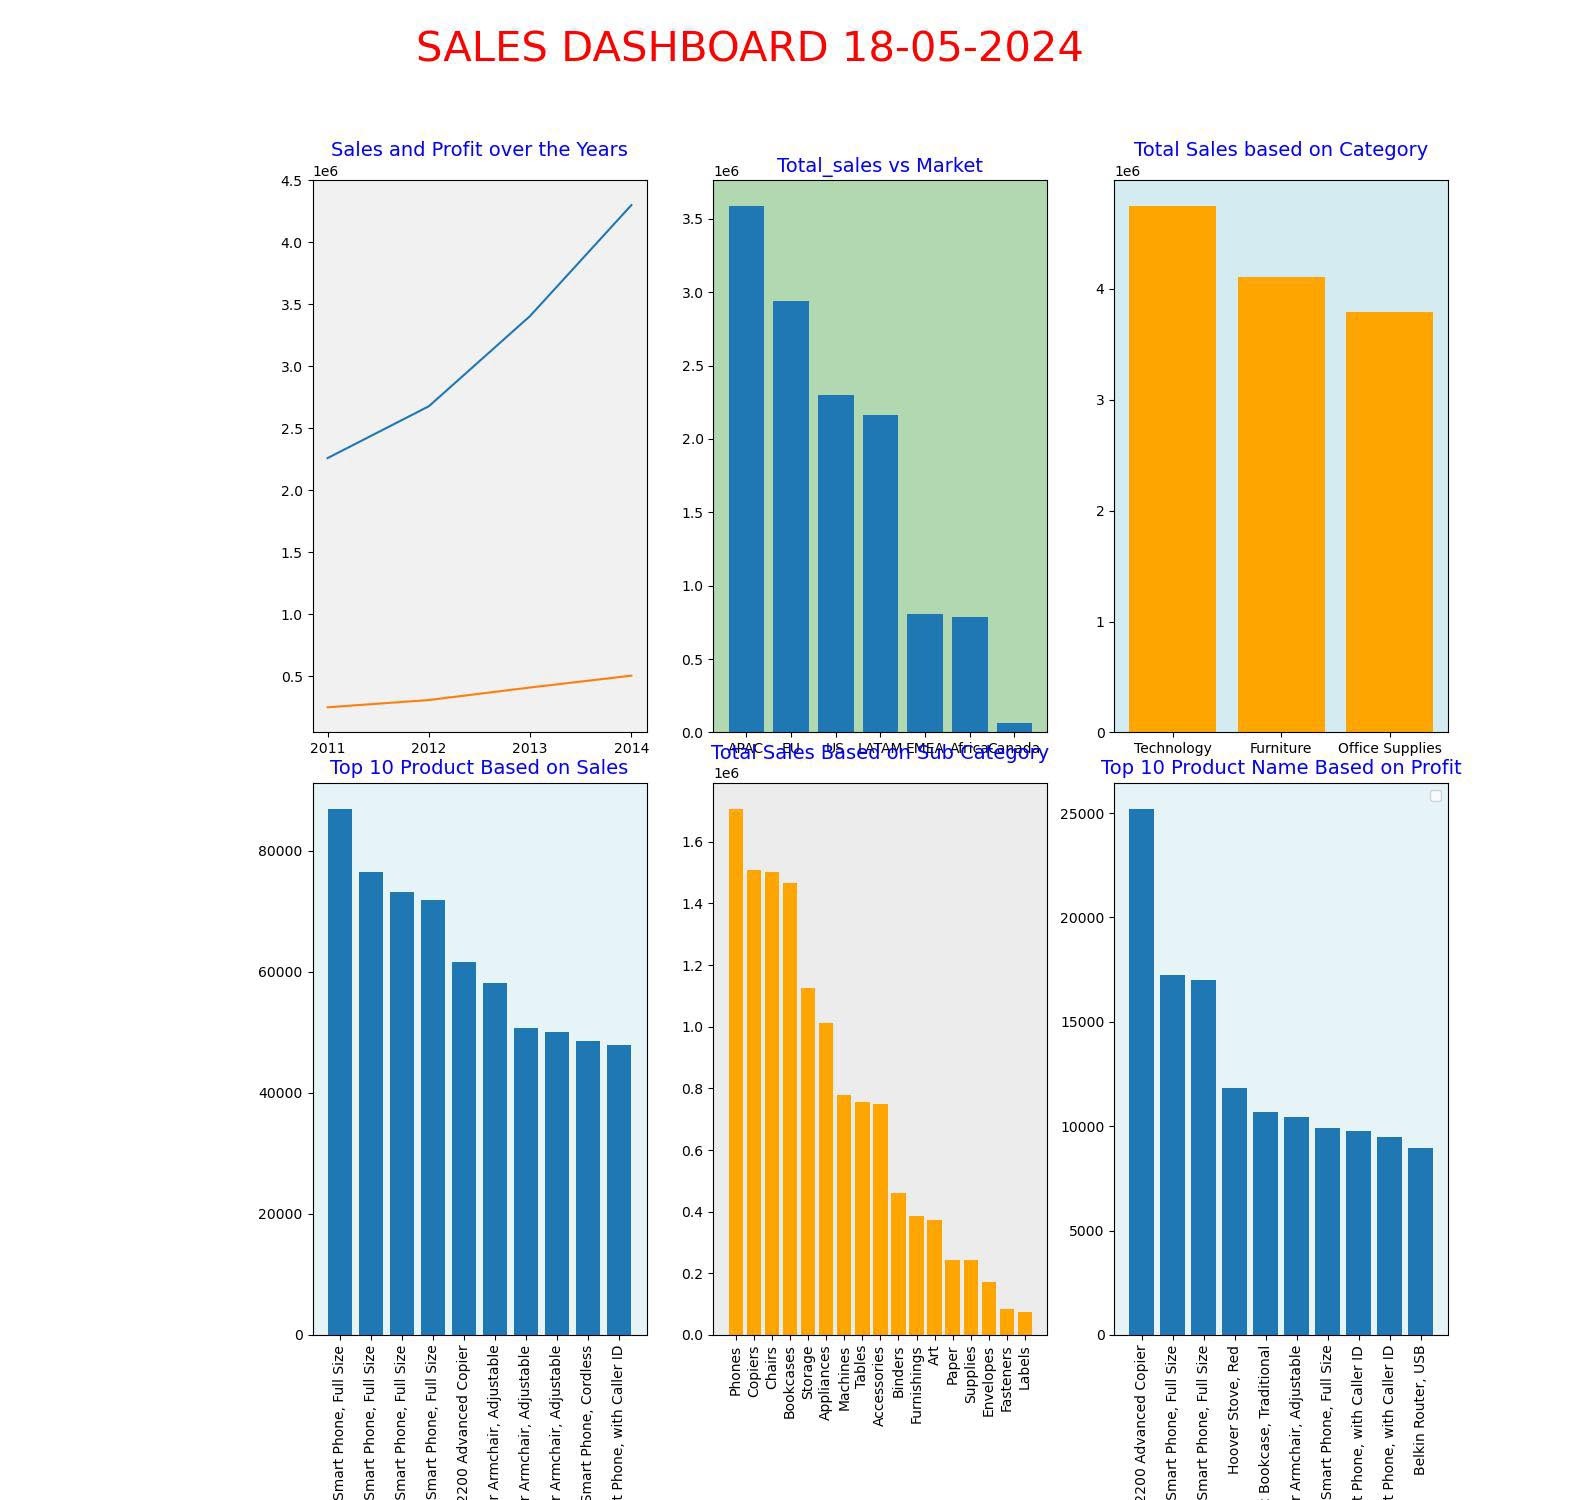
Am super excited on the 1% increase in my matplotlib dashboard mastery, in my first plot I wasn't able to deduce any insight from the plot but on this I can confidently deduce the following: There is a progressive increase in total sales moving from 2011 to 2014 and though the product name "Apple smart phones, full size" has the highest total sales, the highest total profit was recorded for the product "Canon Imageclass2000" etc
Thank you Prof @Stanley Omeike
Like


Comment
Share
Adebayo Olusodo
Delete Comment
Are you sure that you want to delete this comment ?
Julius Abai
Delete Comment
Are you sure that you want to delete this comment ?