Discover posts
Explore captivating content and diverse perspectives on our Discover page. Uncover fresh ideas and engage in meaningful conversations


In Python programming, All Variables are Identifiers BUT not all Identifiers are Variables ie a Variable is a category of an Identifier.
Like
Comment
Share
Like
Comment
Share
Python is CASE SENSITIVE.
It RUNS on its own KEYWORDS.
Python recognizes 3 COLONS as initializing MULTI-LINE COMMENTS.
Like
Comment
Share
# Dr Omeike
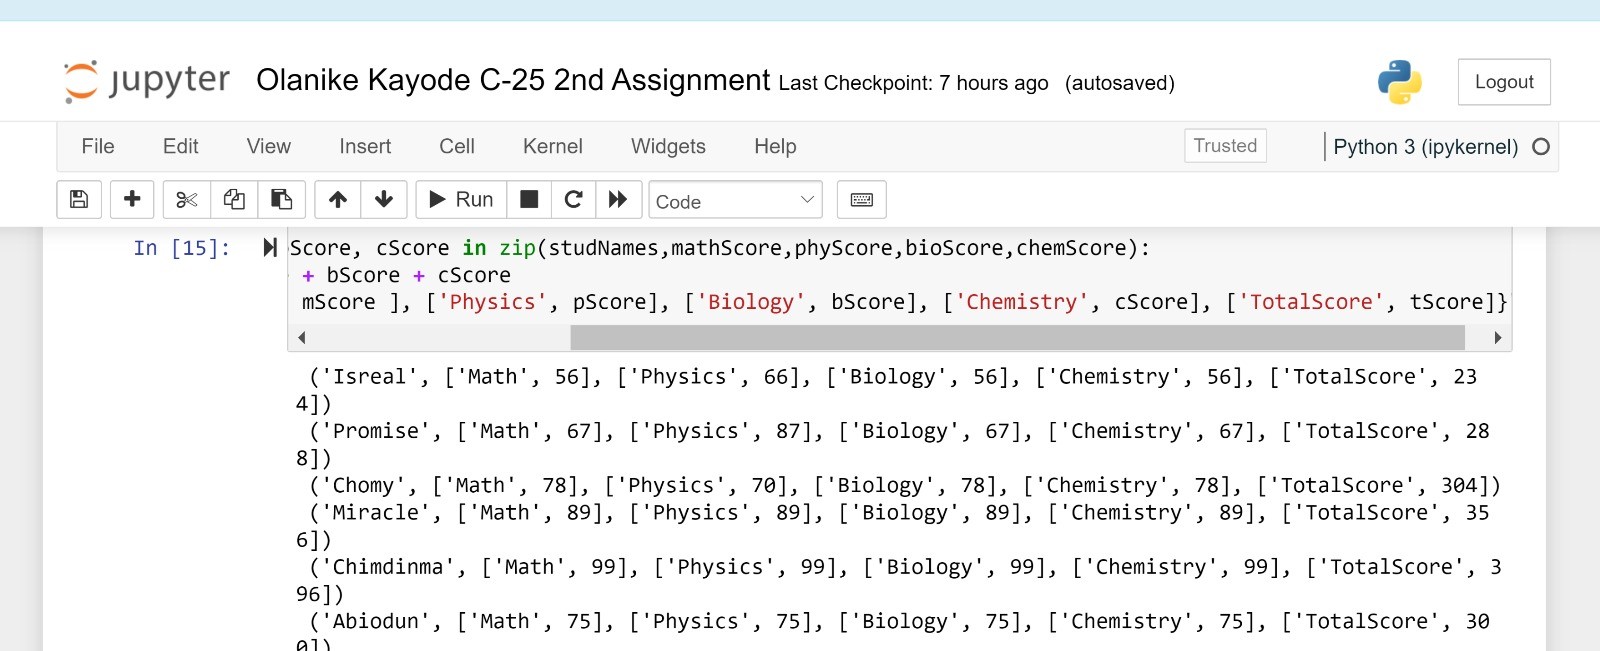
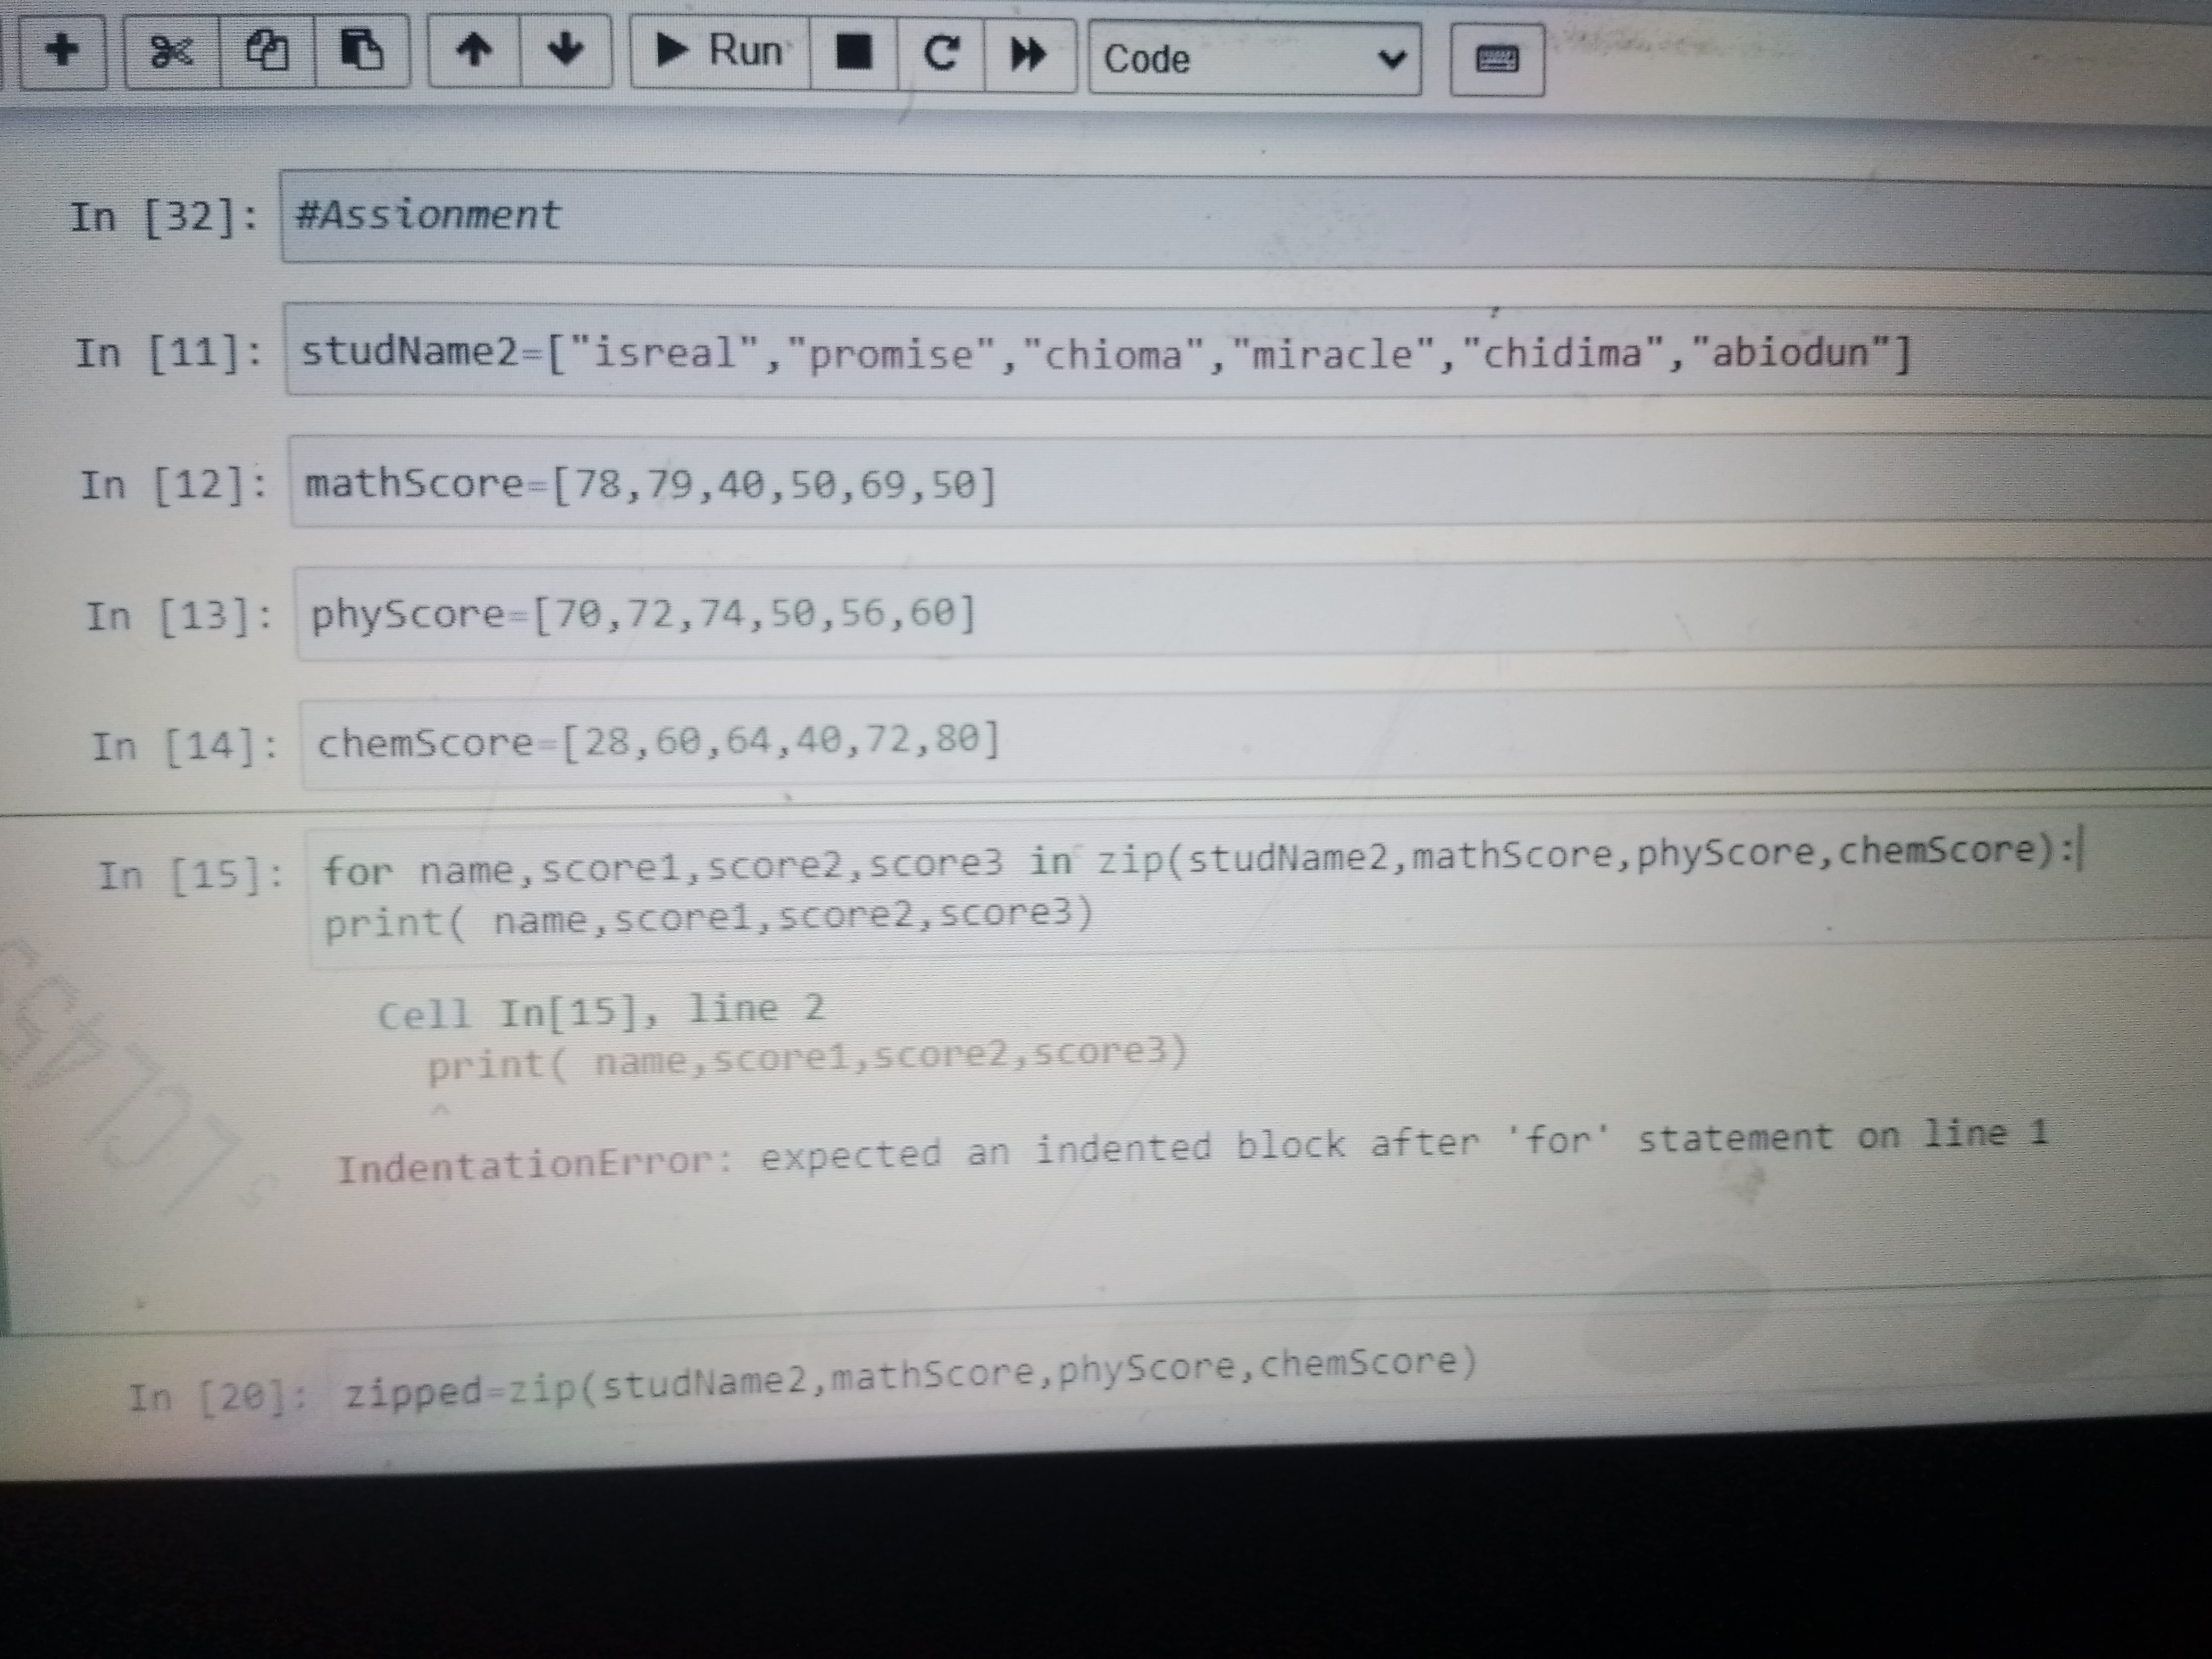
I couldn't get the assignment using the class method until I zip separately
Like
Comment
Share
Like
Comment
Share
Like
Comment
Share
ANOTHER SIMPLE DASH
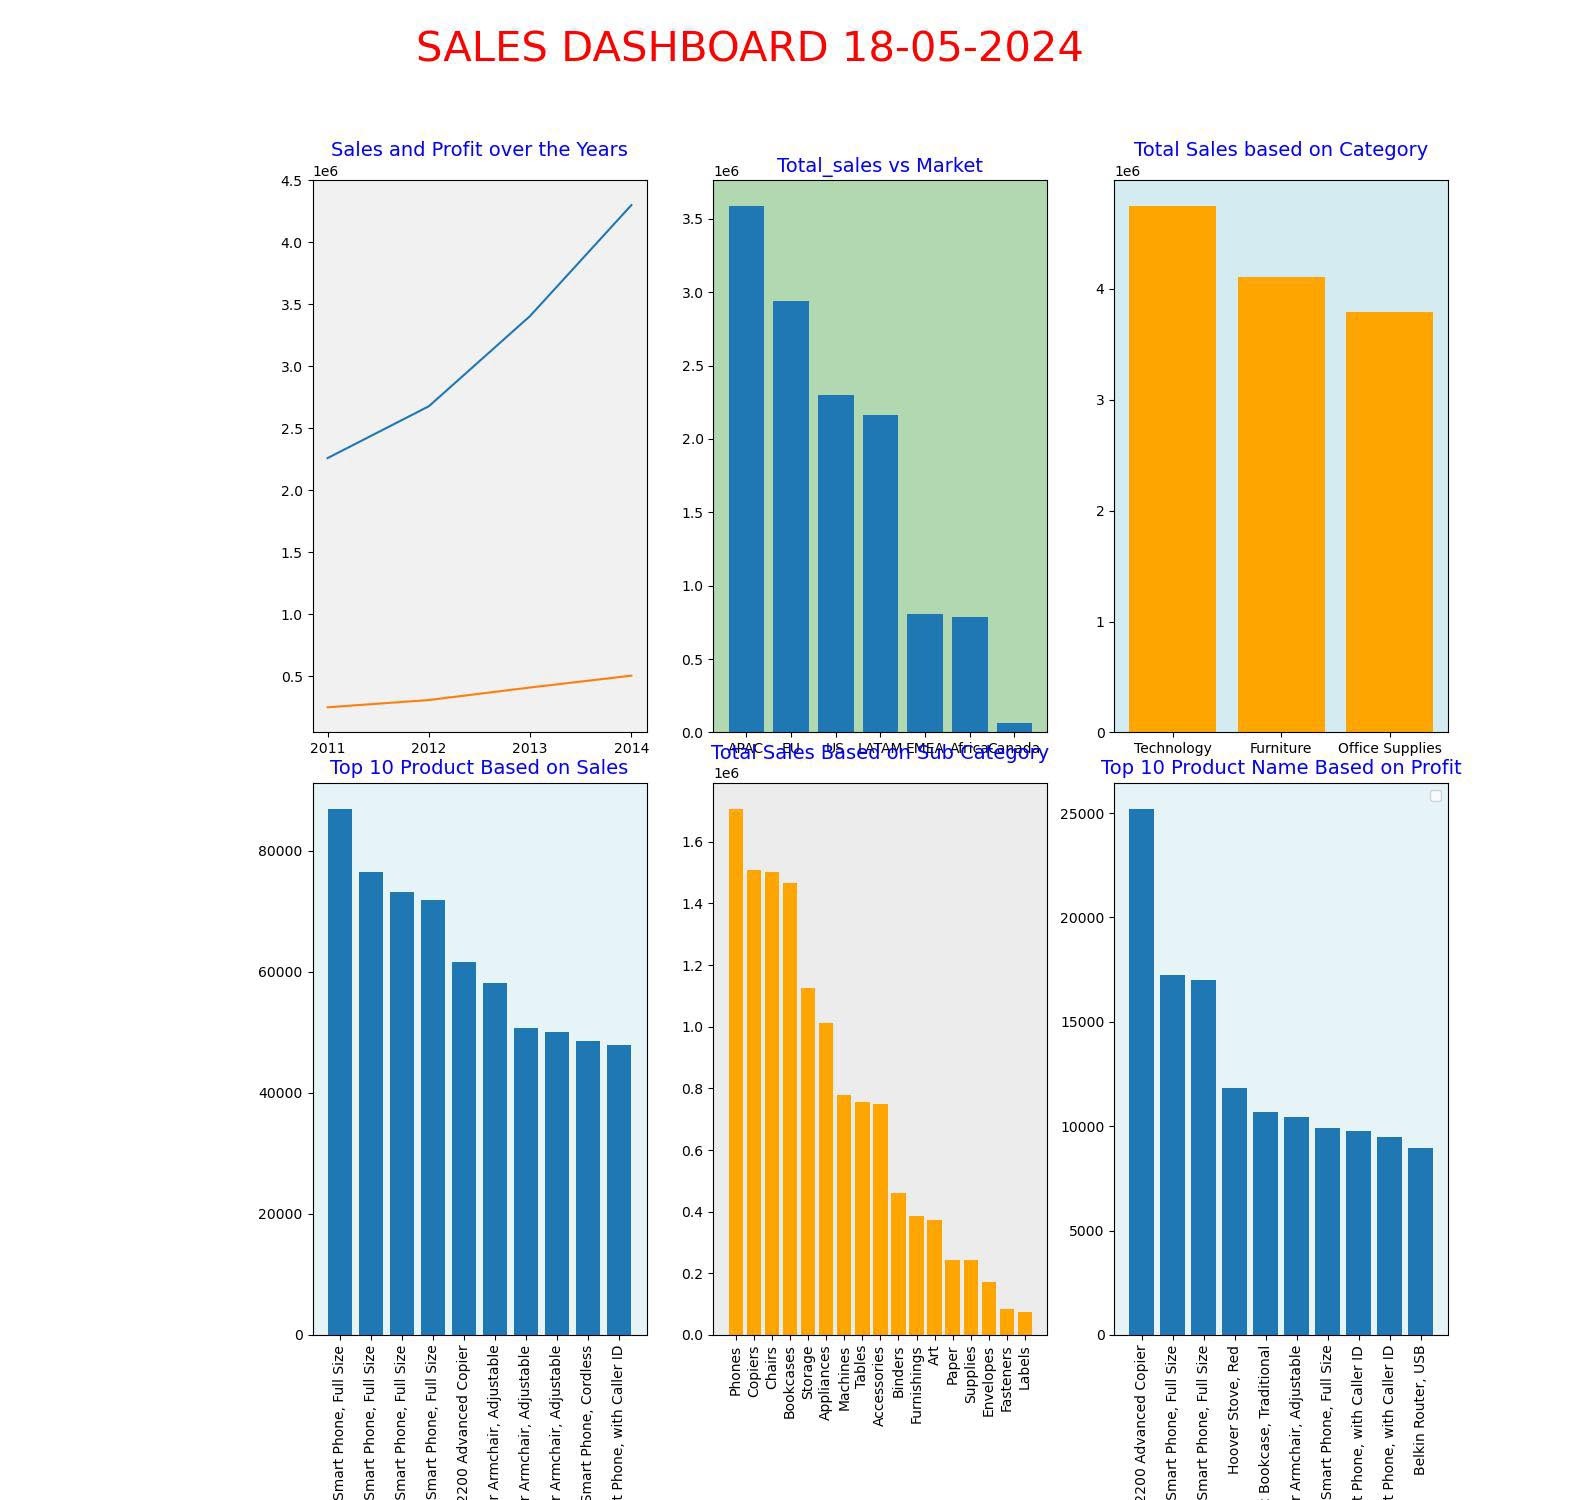
Am super excited on the 1% increase in my matplotlib dashboard mastery, in my first plot I wasn't able to deduce any insight from the plot but on this I can confidently deduce the following: There is a progressive increase in total sales moving from 2011 to 2014 and though the product name "Apple smart phones, full size" has the highest total sales, the highest total profit was recorded for the product "Canon Imageclass2000" etc
Thank you Prof @Stanley Omeike
Like
Comment
Share
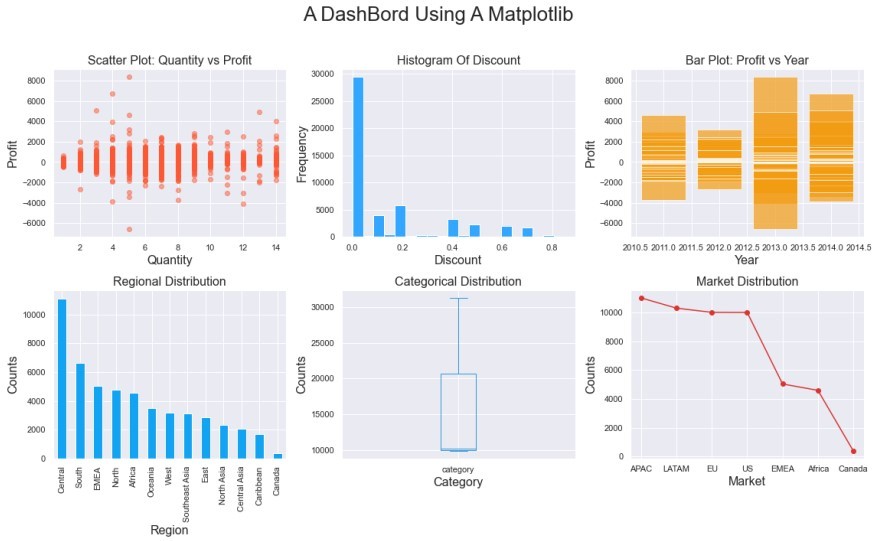
This is a simple dashboard using matplotlib. @Stanley Omeike
#stanleyomeike #onecampus
Like
Comment
Share
Showing 21 out of 48