Completed two Python functions: "vizOutlier" & "vizNumCols".
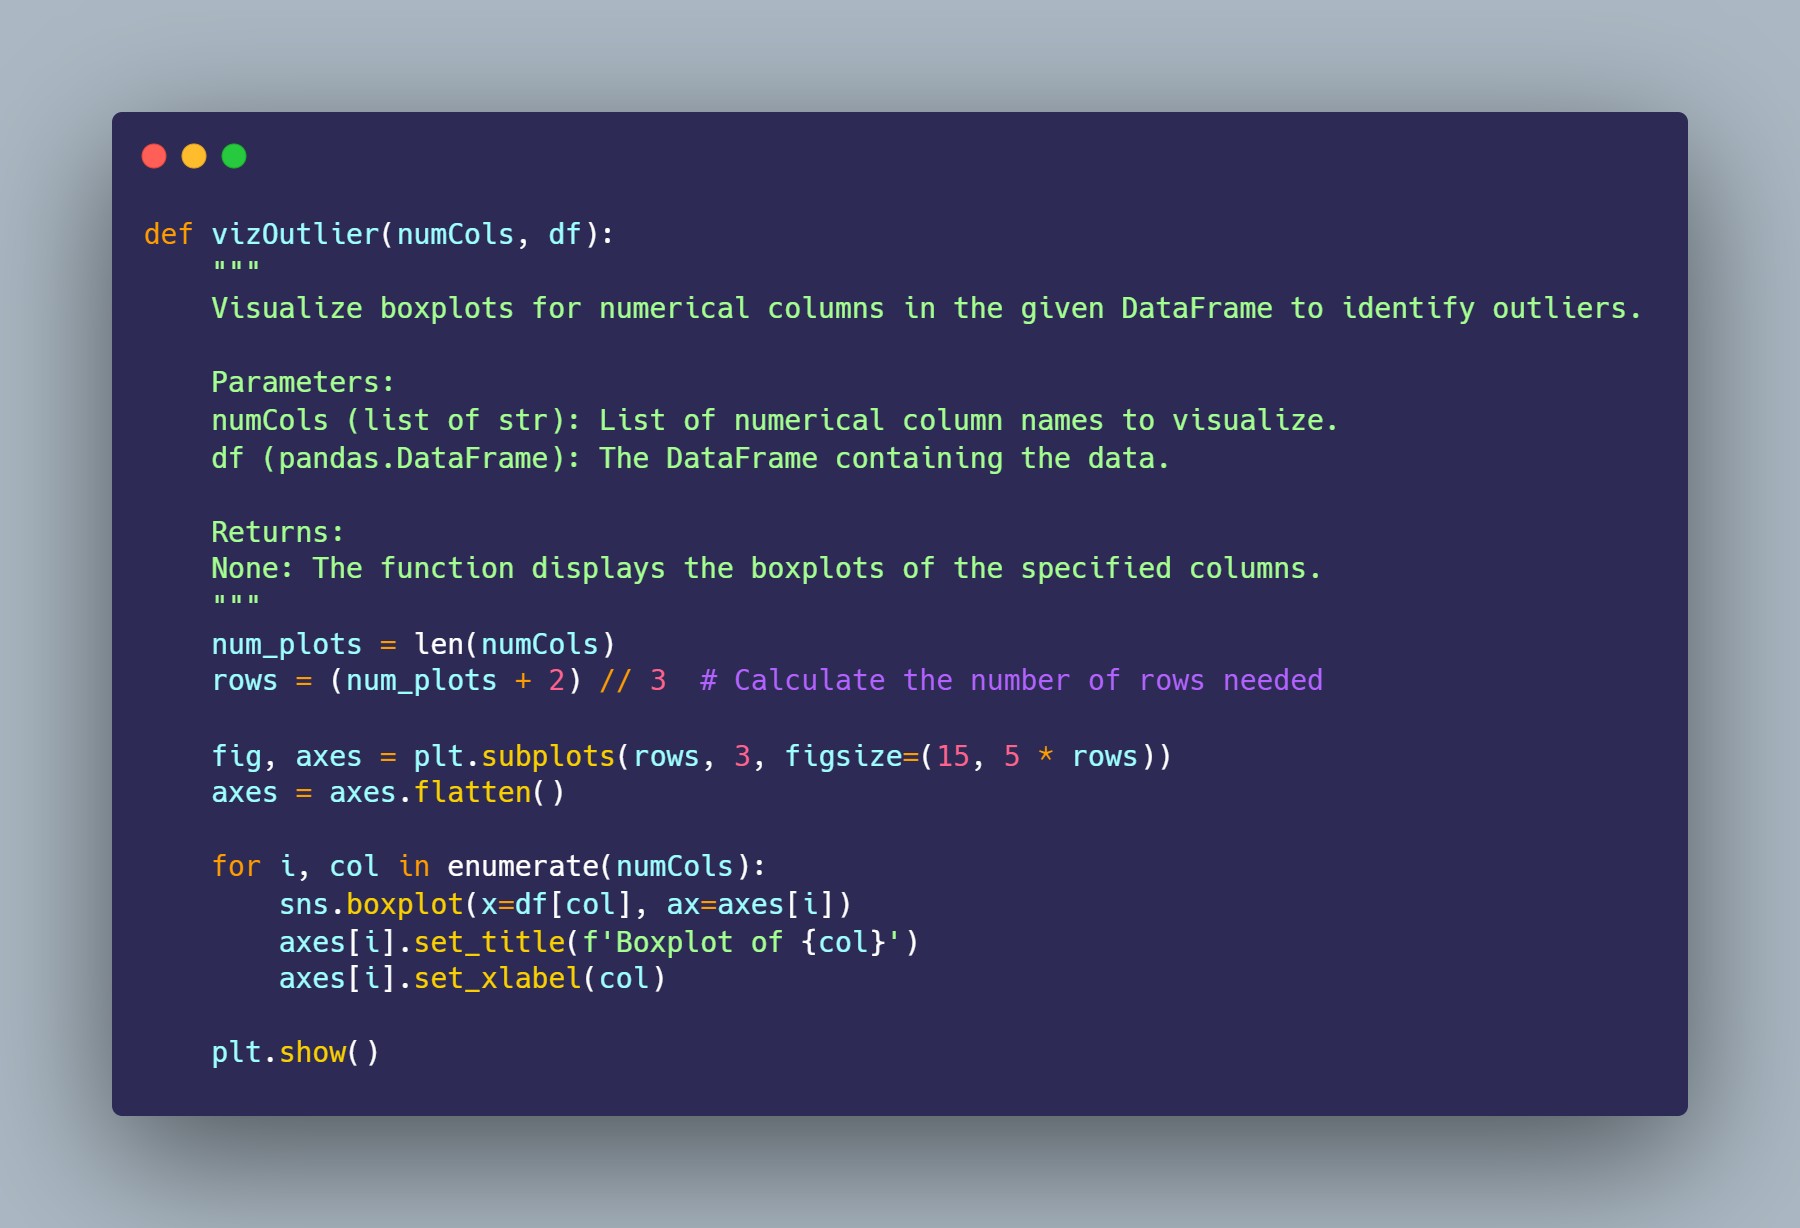
"vizOutlier": Easily Identify Outliers in Your Data with Python!
For a quick and efficient way to visualize outliers in your data,✨ This handy Python function creates boxplots for any numerical columns in your DataFrame, making it simple to spot outliers.
"vizNumCols": Visualize Your Data's Numerical Columns with Ease!
To explore the distribution of your data's numerical columns, this easy Python function generates histograms for any list of numerical columns in your DataFrame.
Like


Comment
Share