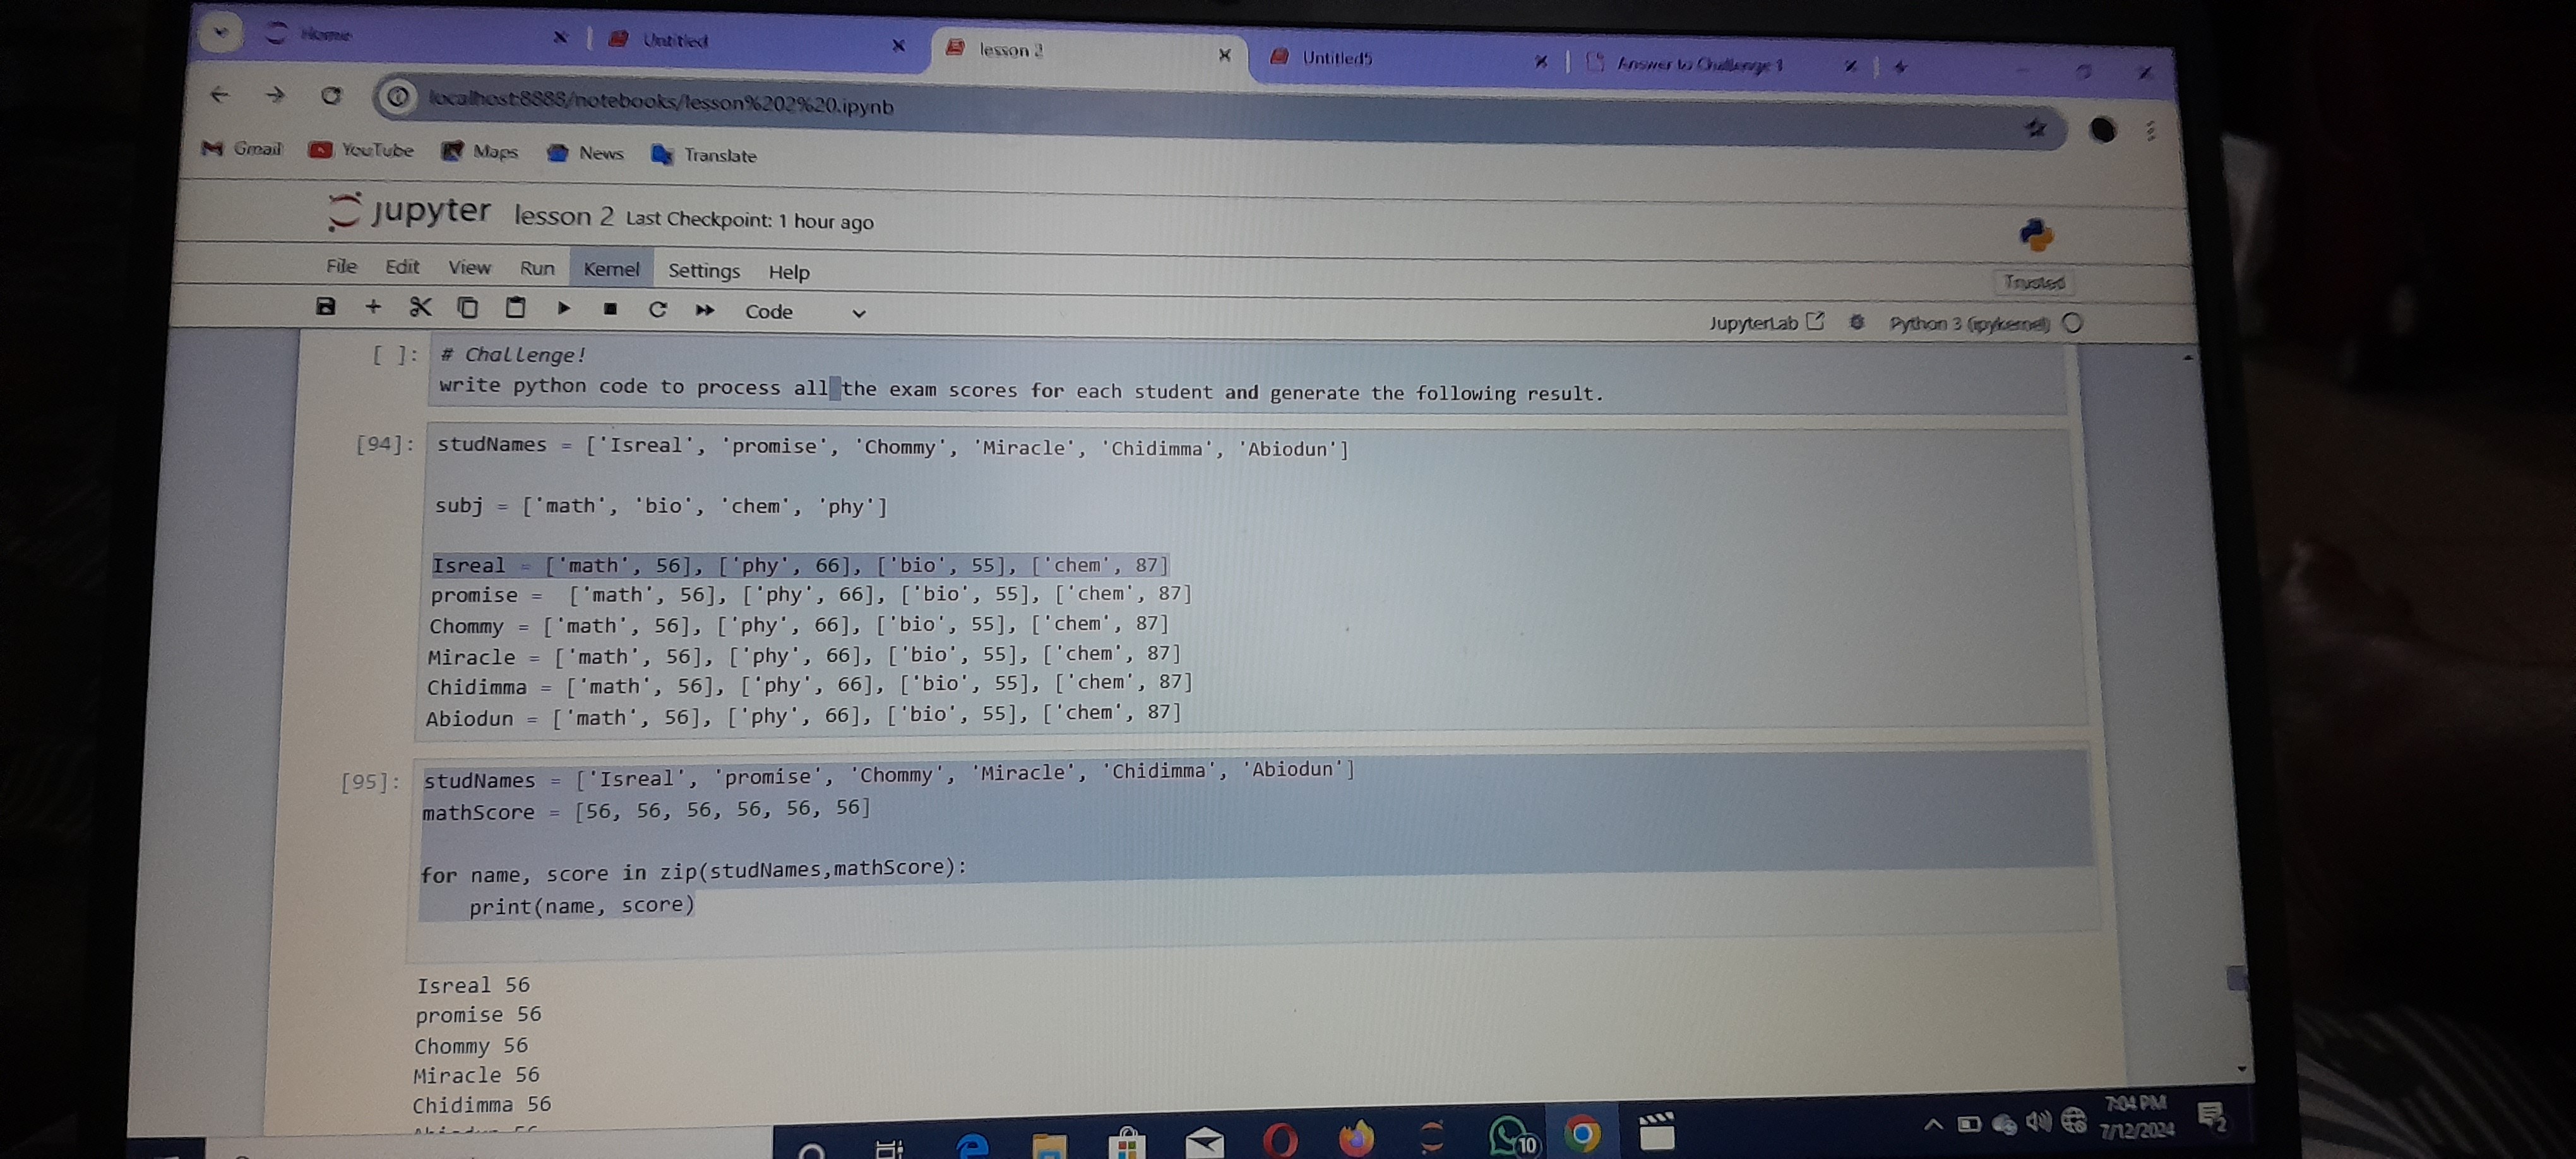
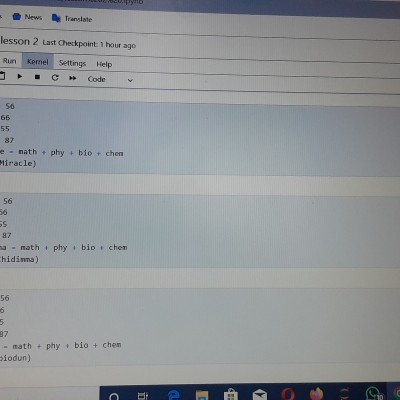
Good evening Prof. Hope you are fine sir. Here is my assignment on lists. I am sorry is just coming now. I had some challenges that made me not to meet up with classes and submission.
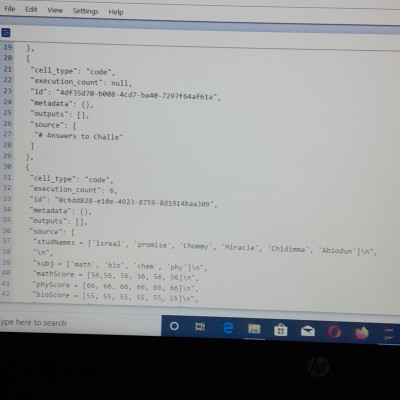
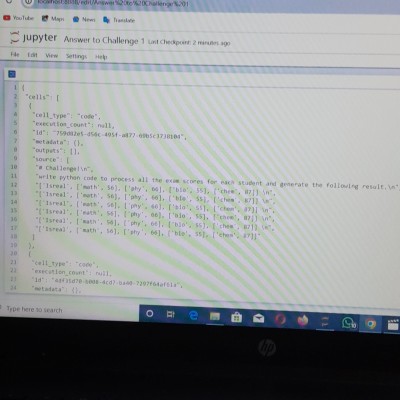
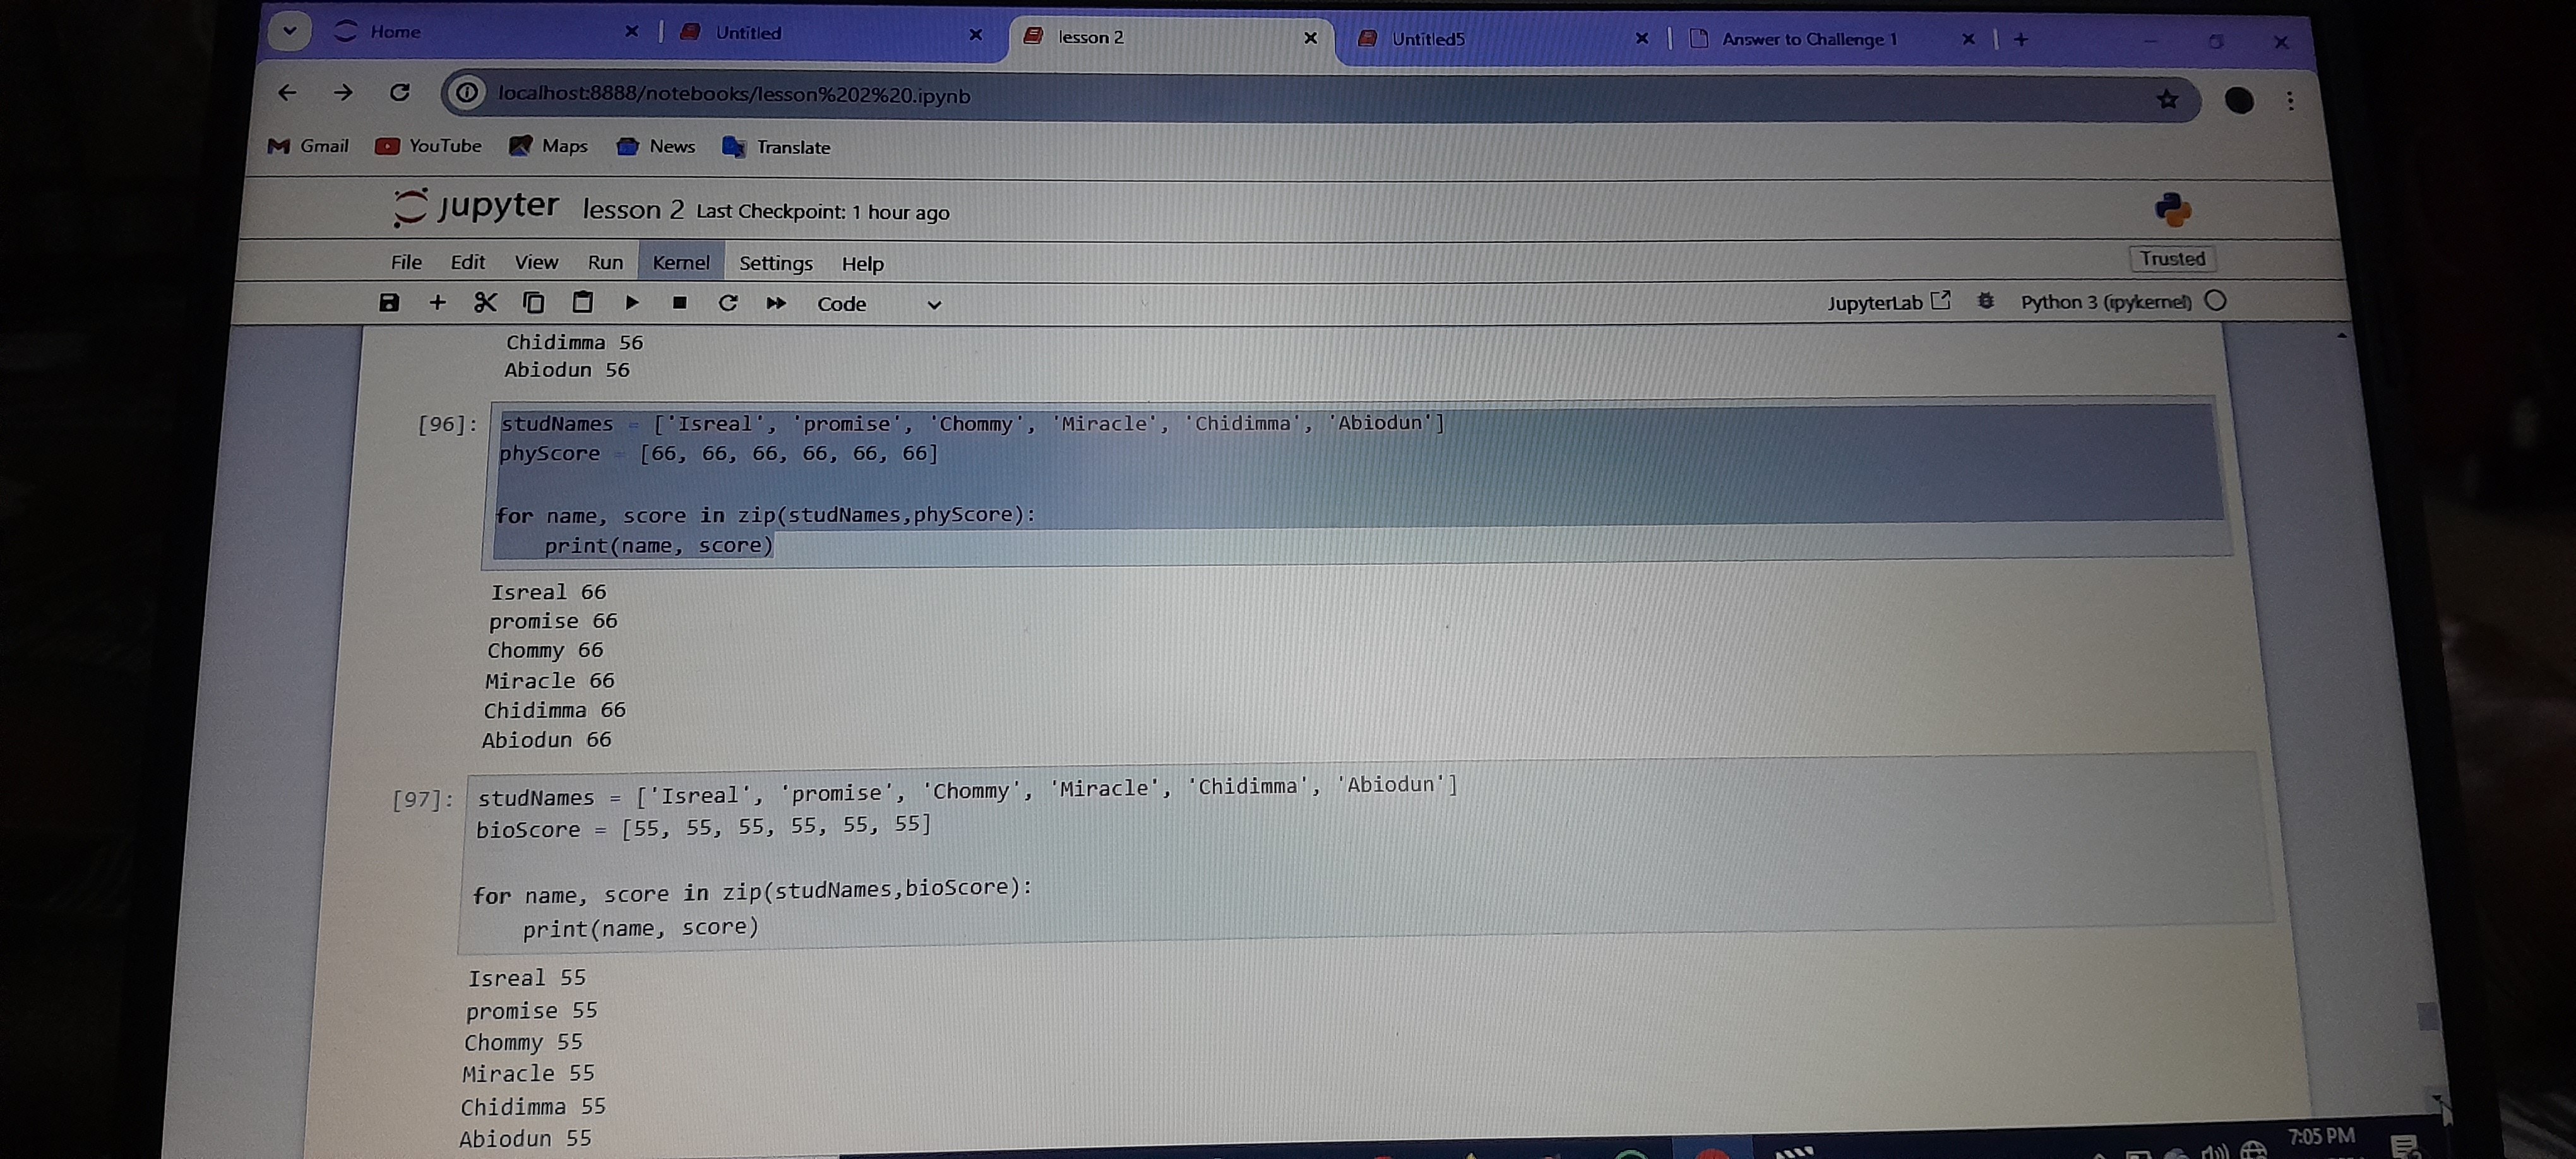
In the second screen shot have to rerange them before coding it but after saving it, it turn out to a different look.
Thank you sir for your understanding
Stanley Omeike
Like


Comment
Share